How Investments Grow Over Time
Regular contributions start the engine, but compounding does most of the work later on. See year by year how a modest monthly investment grows, what changes the outcome most and how inflation fits in.

Most long-term investing follows a simple pattern: you put in a starting amount, add money regularly and let the returns build on themselves. For the first few years the balance looks like little more than your own savings. Then, somewhere along the way, the growth starts to outpace what you add. Understanding when and why that happens makes it much easier to stay patient and to make decisions that actually move the result.
The two sources of your balance
At any point, an investment balance is made of two parts:
- Contributions: the money you put in yourself.
- Growth: the returns earned on your contributions and on earlier growth.
Contributions grow in a straight line. If you add 300 a month, every year adds 3,600, no more and no less. Growth is different. Each year's return is earned on a larger balance than the year before, so the growth part bends upward over time. That curve is compounding.
A worked example over 30 years
Take a starting amount of 5,000, monthly contributions of 300 added at the end of each month and an expected return of 7% a year, held for 30 years. The Investment Calculator gives an end balance of 388,897.06. You contributed 113,000 of that yourself, and 275,897.06 is growth.
Looking at the balance every five years shows how the mix shifts:
- Year 5: 28,371.52 (contributions 23,000, growth 5,371.52)
- Year 10: 61,151.28 (contributions 41,000, growth 20,151.28)
- Year 15: 107,126.59 (contributions 59,000, growth 48,126.59)
- Year 20: 171,609.34 (contributions 77,000, growth 94,609.34)
- Year 25: 262,049.73 (contributions 95,000, growth 167,049.73)
- Year 30: 388,897.06 (contributions 113,000, growth 275,897.06)
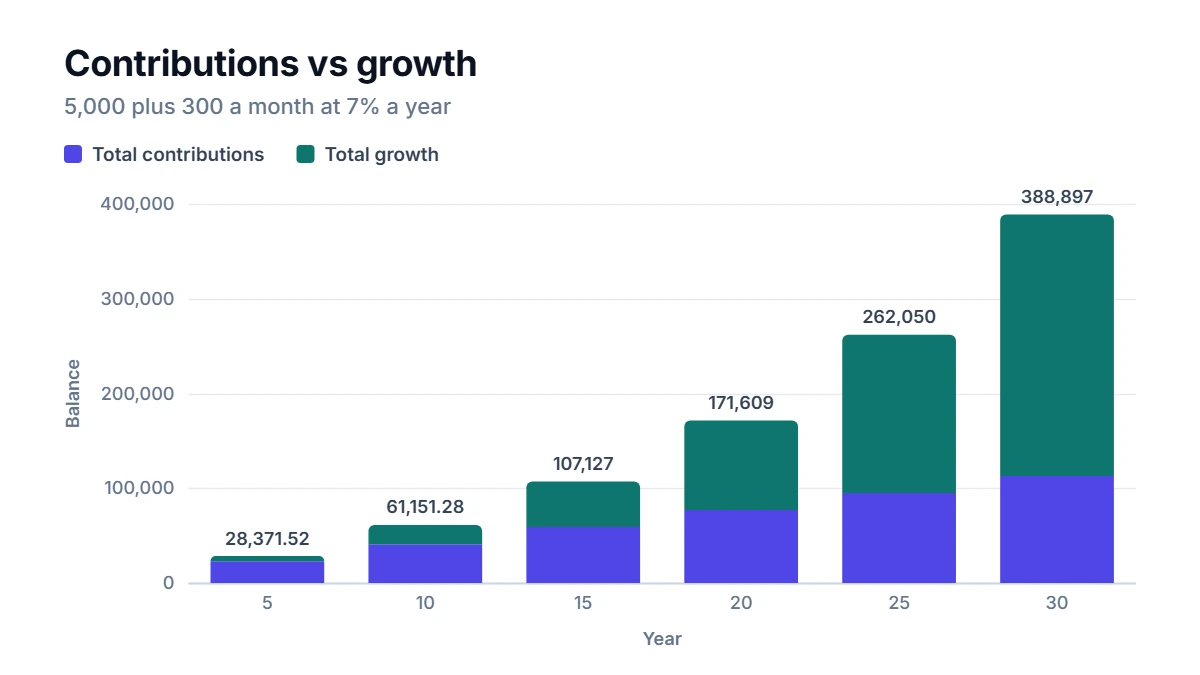
Two turning points stand out. In year 10, the growth earned during that single year (3,871.66) is larger than the 3,600 you added. And in year 18, the total growth so far (73,375.10) passes your total contributions (69,800). After that, the money is mostly working for itself. In the final year alone, growth adds 25,312.97, about seven times your contributions for that year.
Why the last decade matters so much
Compare the balance after 20 years, 171,609.34, with the balance after 30 years, 388,897.06. The last ten years add more than the first twenty put together. That is why starting early is so valuable, and why stopping early is so costly: the years you give up are the most productive ones at the end, not the modest ones at the start.
The flip side is reassuring. If the early years look unimpressive, nothing is wrong. The curve simply has not had time to bend yet.
What changes the result most
The return. Running the same plan at different returns:
- 4% a year: 221,798.16
- 7% a year: 388,897.06
- 10% a year: 706,100.01
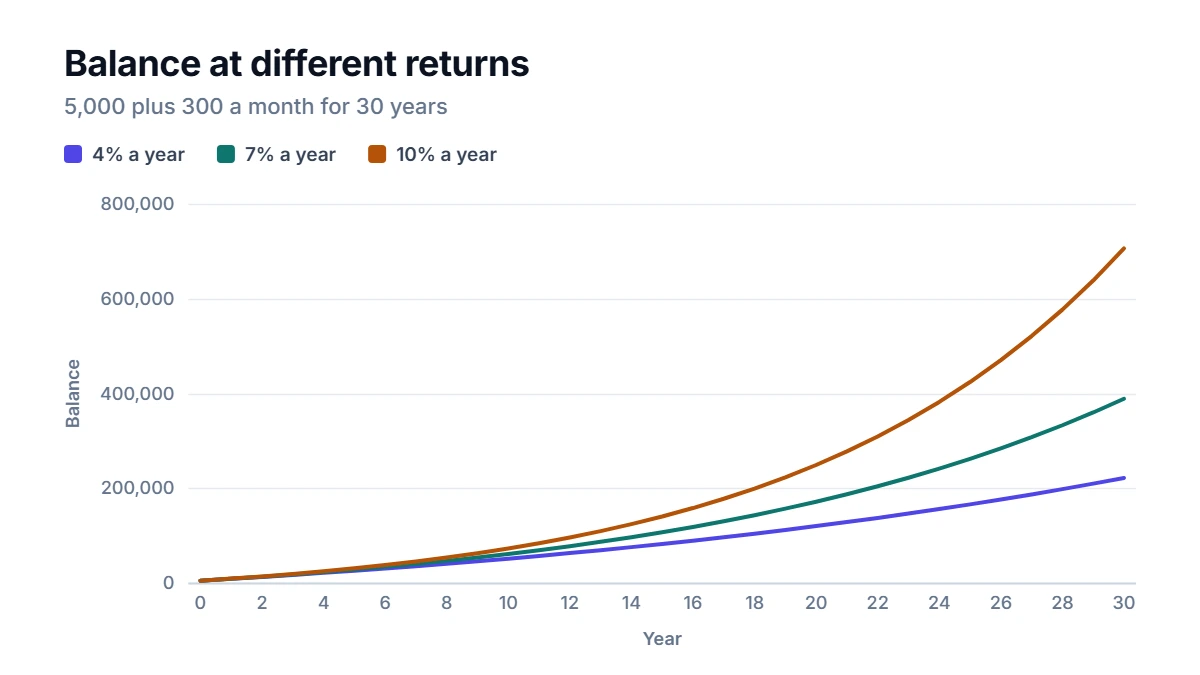
Three percentage points either way almost halves or almost doubles the outcome. This is also why fees matter: a cost of 1% a year turns a 7% return into roughly 6%, and at 6% the same plan ends at 321,071.35, about 68,000 less.
Raising your contribution. Increasing the 300 by 3% every year, roughly in step with a growing salary, lifts the end balance to 519,499.39 for total contributions of 176,271.50. Small regular increases add up because the early ones have decades to grow.
Contribution timing. Investing at the start of each month instead of the end gives 390,880.73. That is about 2,000 more, a real but modest effect. Time in the market matters far more than which day of the month you invest.
Seeing the result in today's money
Nominal balances can look larger than they feel. With 2.5% inflation a year, 388,897.06 in 30 years has the buying power of about 185,403.83 today. That does not mean the plan failed. It means the figure to compare with your goals is the inflation-adjusted one, and it is a reason to use a realistic return assumption rather than an optimistic one.
How to use the investment calculator
Enter the starting amount, the contribution and how often you add it, choose start or end of the period, then the expected return and the number of years. Add an annual contribution increase and an inflation rate if you want them. The yearly table shows contributions, growth and balance, so you can find your own turning points. Try at least three return rates, a cautious, a middle and an optimistic one, and plan around the cautious result.
Common mistakes
- Treating the return as guaranteed. Real markets go up and down. The calculator uses a steady average, so the actual path will be bumpier and the end result can be higher or lower.
- Ignoring fees and taxes. Both reduce the effective return. Check the current rules and costs that apply to your accounts.
- Forgetting that losses need bigger gains. A 20% drop turns 10,000 into 8,000, and it then takes a 25% gain to get back to 10,000.
- Focusing on the nominal number. Always look at the inflation-adjusted balance as well.
These projections are estimates for planning, not financial advice or a forecast of any particular investment.
FAQ
How long does it take for growth to overtake contributions?
It depends mainly on the return. At 7% with steady monthly contributions, yearly growth passes yearly contributions around year 10, and total growth passes total contributions around year 18. Higher returns reach those points sooner, lower returns later.
Is it better to invest a lump sum or spread it out?
A lump sum invested earlier has more time to grow on average, while spreading it out reduces the risk of investing everything just before a fall. Many people simply invest whatever they can, as soon as they have it.
What if I can only invest a small amount?
Start anyway. In the example, more than two thirds of the final balance is growth, and growth needs time more than it needs a big contribution. You can raise the amount later as your income grows.
Why use 7% as an example return?
It is a round figure often used for illustration of a diversified long-term portfolio before inflation. It is not a promise. Use your own assumptions and test lower ones too.

