Mean vs Median vs Mode: Which Average Should You Use?
Mean, median and mode are all called "the average", but they can tell very different stories about the same numbers. Learn how each one works, when it misleads and how to choose the right one.

"The average house price rose." "The average worker earns this much." "The average family has two children." Each of these statements uses a different kind of average, and the word alone does not tell you which. The three common ones, the mean, the median and the mode, summarize a list of numbers in different ways. When the data is neat and symmetric they agree. When it is not, choosing the wrong one can paint a misleading picture.
Three ways to find the middle
- Mean: add every value and divide by the number of values. It uses every number, which is its strength and its weakness.
- Median: sort the values and take the one in the middle. With an even count, average the two middle values. It depends only on the order, not on how far out the extremes are.
- Mode: the value that appears most often. A list can have one mode, several, or none at all.
A worked example with one outlier
Imagine nine people at a small company. Their annual salaries, in thousands, are:
42, 45, 45, 48, 51, 53, 56, 60, 250
The last value belongs to the founder. Here is what each average says:
- Mean: the sum is 650, so the mean is 650 / 9 = 72.22.
- Median: the list is already sorted, and the fifth of nine values is 51.
- Mode: 45 appears twice and every other value once, so the mode is 45.
Eight of the nine people earn 60 or less, yet the mean says the typical salary is above 72. The single large value has dragged it up. The median, 51, sits right among the actual salaries.
Now remove the founder and look at the remaining eight:
- Mean: 400 / 8 = 50
- Median: the two middle values are 48 and 51, so the median is 49.5
- Mode: still 45
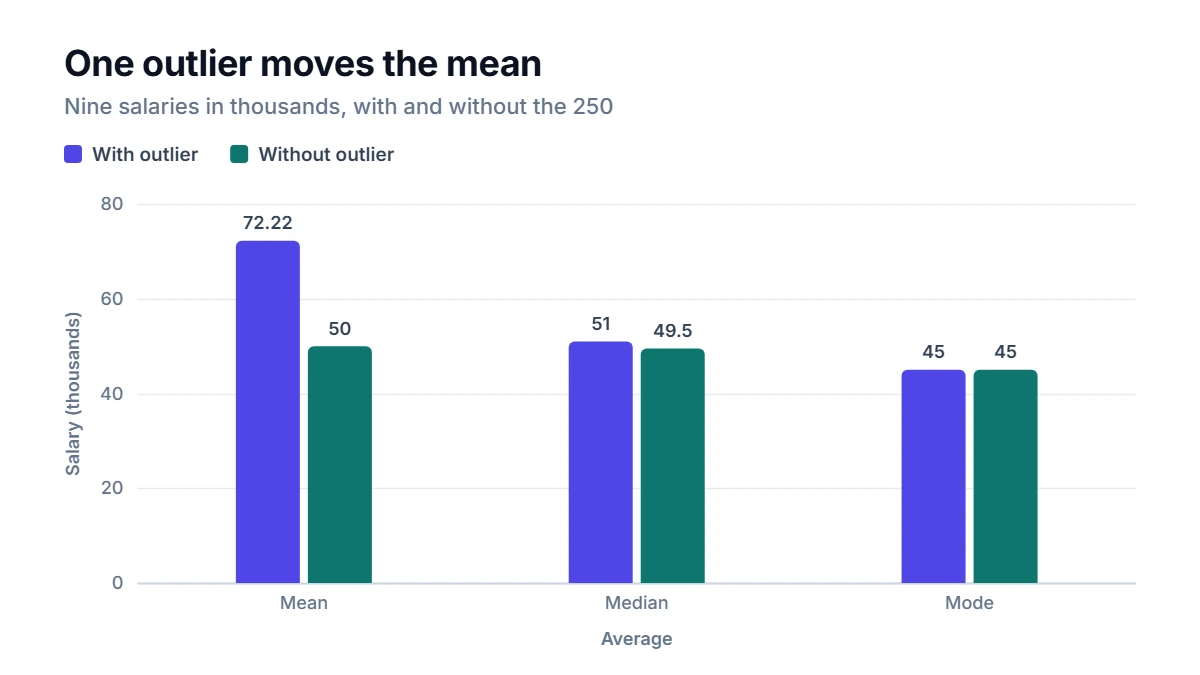
Removing one person moved the mean by more than 22 but the median by only 1.5. That is the core difference: the mean is sensitive to extreme values, the median is robust against them.
Spread tells you how much to trust the average
An average on its own hides how scattered the values are. The standard deviation measures that. For the nine salaries, the population standard deviation is about 63.09. For the eight without the founder, it is about 5.74. A standard deviation almost as large as the mean is a strong hint that the mean is not describing a typical member of the group.
The range tells a similar story: 208 with the founder, 18 without. Whenever you report an average, it is worth checking the spread too.
Which average should you use?
Use the mean when the data is roughly symmetric without extreme outliers, such as test scores in a large class, daily temperatures or the weights of products from the same machine. It is also the right choice when totals matter: if you know the mean spending per customer, multiplying by the number of customers gives total sales. The median cannot do that.
Use the median when the data is skewed or has outliers. Incomes, house prices, wealth and waiting times all have long tails to one side. This is why official statistics about household income or home prices often report the median.
Use the mode when the data is categorical or you care about the most common value. The most popular shoe size, the most common answer in a survey or the busiest hour of the day are mode questions. The mode is the only one of the three that works for non-numeric data like colors or brands.
A useful rule of thumb: when the mean is clearly larger than the median, the data has a long tail of high values. When the mean is clearly smaller, the tail is on the low side.
How to use the calculator
Paste your numbers into the Mean, Median, Mode Calculator, separated by commas, spaces or new lines, and press Calculate. You get the mean, median, mode, range, minimum, maximum and sum, plus both the population and the sample standard deviation. A quick experiment shows the ideas above in action: calculate once, then add or remove one extreme value and calculate again. Watch how far the mean moves compared with the median.
Common mistakes
- Averaging averages. The mean of two group means is only correct if the groups are the same size. Otherwise, weight each mean by its group size.
- Reporting a mean for skewed data without saying so. Readers will assume it describes a typical value.
- Expecting a mode in every data set. If every value is different, as is common with precise measurements, there is no mode. Grouping values into ranges can reveal a most common range instead.
- Thinking the median ignores the data. It uses every value to determine the order. It just does not care how extreme the extremes are.
FAQ
Can the mean, median and mode all be the same?
Yes. In a perfectly symmetric data set with a single peak, such as 2, 3, 3, 4, all three equal 3. The more lopsided the data, the further apart they drift.
Which average do news reports usually use?
It varies. Many reports on income and house prices use the median because those figures are skewed. Others use the mean, sometimes without saying so. If a report just says "average", look for a note on the method.
Should I remove outliers before calculating the mean?
Only if they are errors or clearly do not belong to the group you are studying. A genuine extreme value is part of the data. Instead of deleting it, you can report the median alongside the mean, or both results with and without the outlier.
Is the median always one of the values in the list?
With an odd number of values, yes. With an even number, the median is the average of the two middle values, so it may not appear in the list at all, as with 49.5 in the example above.
