What Is Standard Deviation?
Two groups can share the same average and still look nothing alike. Learn what standard deviation measures, how to calculate it step by step, and how to read the result.

An average tells you where the middle of your data is. It does not tell you whether the values are packed tightly around that middle or scattered far from it. Standard deviation fills that gap. It is a single number that says how far, on a typical day, a value sits from the average.
Same average, very different stories
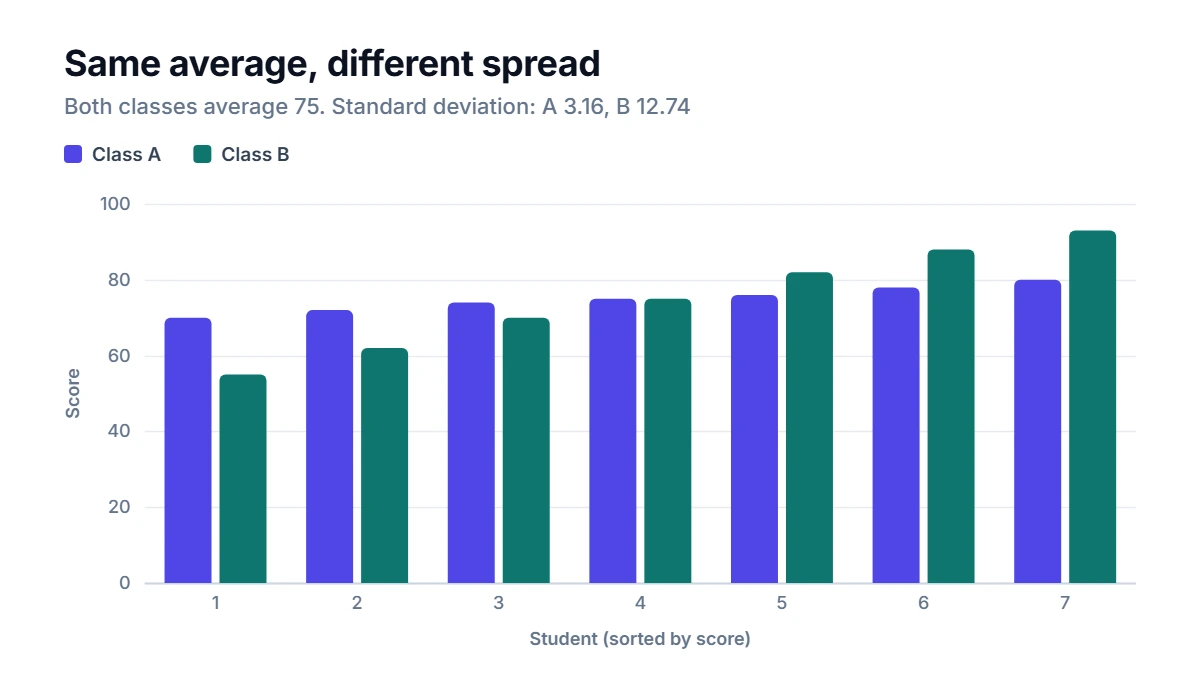
Imagine two classes of seven students who took the same test. Both classes have an average score of exactly 75.
- Class A scored 70, 72, 74, 75, 76, 78 and 80.
- Class B scored 55, 62, 70, 75, 82, 88 and 93.
If you only looked at the average, the two classes would look identical. But in Class A every student is within 5 points of 75, while in Class B the scores range from 55 to 93. The standard deviation captures that difference: about 3.16 for Class A and about 12.74 for Class B.
How standard deviation is calculated
The idea is to measure how far each value is from the mean, then find a kind of average of those distances. Here are the steps, using Class A.
- Find the mean. Add the scores and divide by the count: 525 ÷ 7 = 75.
- Find each deviation. Subtract the mean from each score: -5, -3, -1, 0, 1, 3, 5. These always add up to zero, which is why you cannot simply average them.
- Square each deviation. Squaring removes the minus signs and gives more weight to values that are far away: 25, 9, 1, 0, 1, 9, 25.
- Add the squares. 25 + 9 + 1 + 0 + 1 + 9 + 25 = 70.
- Divide to get the variance. For a whole population, divide by the count: 70 ÷ 7 = 10. For a sample, divide by the count minus one: 70 ÷ 6 ≈ 11.67.
- Take the square root. The square root of 10 is about 3.16 (population). The square root of 11.67 is about 3.42 (sample).
The square root at the end brings the answer back into the same units as the data. The variance of Class A is "10 points squared", which is hard to picture. The standard deviation, 3.16 points, is easy.
The same steps for Class B
The deviations are -20, -13, -5, 0, 7, 13 and 18. Their squares are 400, 169, 25, 0, 49, 169 and 324, which add up to 1,136. Dividing by 7 gives a variance of about 162.29, and its square root is about 12.74. As a sample it would be 1,136 ÷ 6 ≈ 189.33, giving about 13.76.
Sample or population: which one?
The only difference between the two versions is the number you divide by.
- Use population (divide by n) when your list includes every member of the group you care about. Each class above is a complete group, so the population value is the right one if you only want to describe that class.
- Use sample (divide by n − 1) when your data is a subset that stands in for something bigger, for example seven students picked to represent a whole school. A small sample tends to underestimate the true spread, and dividing by one less corrects for that.
The sample value is always a little larger. With large data sets the difference becomes tiny.
How to read a standard deviation
A standard deviation means little on its own. It becomes useful when you compare it with the mean and with other groups.
- Relative to the mean. A spread of 12 points matters on a 100-point test. A spread of 12 grams on a 1,000-gram bag of rice is tiny.
- Within one standard deviation. For data that is roughly bell-shaped, about two-thirds of the values fall within one standard deviation of the mean, and about 95% within two. In Class A, one standard deviation either side of 75 covers about 71.8 to 78.2, and five of the seven scores fall in that range.
- Comparing consistency. A factory, a delivery service or a runner with a lower standard deviation is more predictable, even if the average is the same.
Outliers pull it up fast
Because deviations are squared, one unusual value can change the standard deviation a lot. Take ten daily commute times in minutes: 22, 25, 24, 23, 26, 24, 25, 23, 60 and 28. One day there was a traffic jam.
- With all ten values: mean 28, sample standard deviation about 11.37.
- Without the 60-minute day: mean about 24.44, sample standard deviation about 1.81.
A single bad day makes the commute look six times less predictable than it usually is. When a result looks surprisingly large, check the data for typos and genuine one-offs, and decide whether they belong in the analysis.
How to use the Standard Deviation Calculator
The Standard Deviation Calculator does every step above for you:
- Choose Sample or Population.
- Paste or type your numbers, separated by commas, spaces or new lines. Do not use thousands separators, because a comma starts a new number.
- Press Calculate.
You get the standard deviation, the variance, the mean, the count, the sum and the standard error of the mean. The details table lists each value with its deviation and squared deviation, so you can follow the working or check it against your own.
Common mistakes
- Using the wrong version. If your numbers are a sample but you choose population, the spread comes out slightly too small.
- Forgetting the square root. The variance and the standard deviation are different numbers in different units.
- Comparing spreads on different scales. Compare standard deviations only when the data uses the same units and similar averages, or divide each by its mean first.
- Treating it as the maximum distance. Many values will be further than one standard deviation from the mean. It is a typical distance, not a limit.
FAQ
Can a standard deviation be negative?
No. It is a square root of a sum of squares, so it is always zero or positive. Zero means every value is exactly the same.
Is a high standard deviation bad?
Not by itself. It just means the values vary a lot. In a product's weight that may be a problem; in the ages of people at a family party it is completely normal. Whether it is good or bad depends on what you are measuring.
What is the difference between standard deviation and range?
The range is the gap between the largest and smallest value, so it depends only on those two values. The standard deviation uses every value, which makes it a steadier measure of spread when you have more than a handful of data points.
How many values do I need for a meaningful standard deviation?
You can calculate it from two values, but the result is not very reliable with so few. With a dozen or more values, the number becomes much more stable and easier to trust.
